Crypto prices don’t just move. They move together. Bitcoin, Ethereum, Solana, XRP, Cardano — most days, they go the same direction at roughly the same time. And most beginners don’t understand why that happens, which leads to some expensive misconceptions.
This article answers why do crypto prices move together in plain English. You’ll learn the three mechanisms that drive crypto correlation — Bitcoin dominance, leverage cascades, and macro sentiment — plus what alt season actually is, why crypto now tracks the stock market, and why owning ten different coins doesn’t diversify you the way you think it does.
I’ve been in crypto since 2017. I’ve watched entire portfolios of “different” coins move as one asset in every bear market I’ve lived through. If you think buying ten cryptos means you’re spreading risk, you’re about to find out that’s not how the math works.
TL;DR
- Most crypto prices move together most of the time — not because the coins are similar, but because three specific mechanisms connect them.
- Mechanism 1: Bitcoin dominance. Bitcoin is close to 58% of the crypto market. Where BTC goes, the market goes.
- Mechanism 2: Leverage cascades. Automatic liquidations of borrowed positions force simultaneous selling across every coin.
- Mechanism 3: Macro sentiment. Fed decisions and stock market moves affect all risk assets, and crypto is now one of them.
- Alt season temporarily changes which coins lead — but correlation always returns.
- Crypto now moves with the S&P 500. A hawkish Fed speech drops both markets the same day.
- Diversifying across ten cryptos is buying ten tickers of the same bet.
The one-sentence version
So, why do crypto prices move together, in one sentence?
Crypto prices move together because three mechanisms — Bitcoin’s market dominance, leverage cascade dynamics, and shared macro sentiment — connect the entire market into a single risk-on/risk-off trade that responds more to Fed speeches than to individual project fundamentals.
That’s the whole thing. Everything else in this article is unpacking why that sentence matters for how you actually think about crypto.
What “correlated” means in crypto prices
Before the mechanisms, one bit of vocabulary — because “crypto correlation” gets thrown around a lot and it’s worth being precise.
What correlation means in one line
Correlation is a fancy word for “these things move together.” If Bitcoin goes up and Ethereum goes up at the same time, they’re correlated. If Bitcoin drops and Ethereum drops on the same afternoon, still correlated. The direction lines up.
Positive, negative, and near-zero
Analysts usually measure correlation on a scale from -1 to +1.
- +1 = perfectly positively correlated. Two things move exactly together, every time.
- 0 = independent. One doesn’t tell you anything about the other.
- -1 = perfectly negatively correlated. When one goes up, the other goes down.
Most crypto pairs — Bitcoin and Ethereum, Bitcoin and Solana, Bitcoin and XRP — sit somewhere between +0.7 and +0.9 over any given 30-day window. That’s not “sometimes they move together.” That’s “they almost always move together.”
Why crypto is usually positively correlated
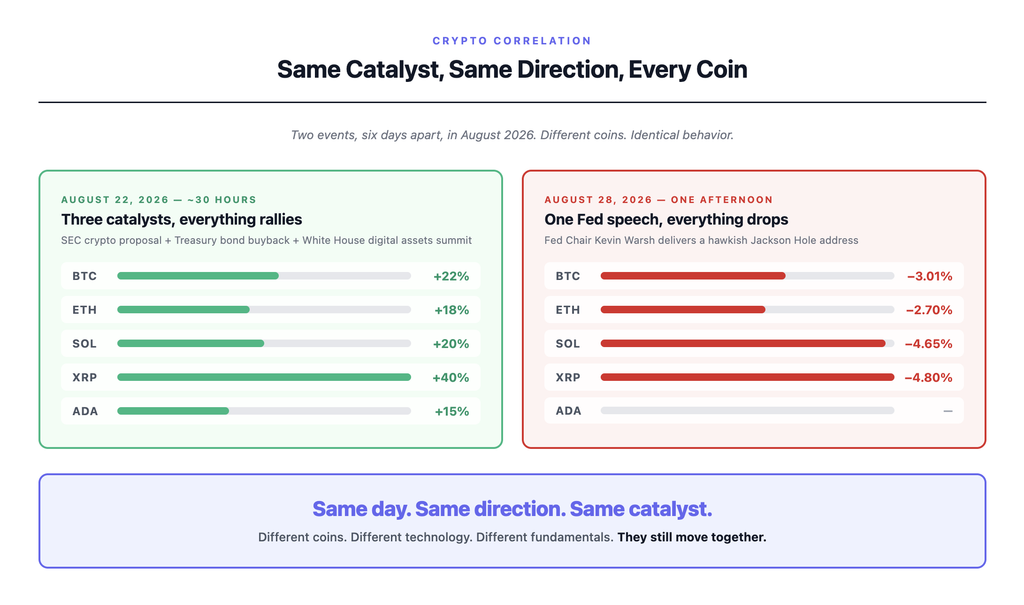
The clearest recent example: the week of August 22, 2026. Three catalysts hit in roughly 30 hours — an SEC crypto proposal, a Treasury bond buyback announcement, and a White House digital assets summit. Over that window, Bitcoin ran +22%, Ethereum +18%, Solana +20%, XRP +40%, Cardano +15%.
Different coins. Different technology. Different fundamentals. Same directional move, same window.
Six days later, on August 28, Fed Chair Kevin Warsh gave a hawkish Jackson Hole speech. Bitcoin dropped 3.01%. Ethereum dropped 2.70%. Solana dropped 4.65%. XRP dropped 4.80%.
One speech. Every major crypto down together. That’s what correlation looks like in the wild.
Correlation isn’t perfect — Solana is usually more volatile than Bitcoin, so it amplifies BTC’s moves. But the direction almost always agrees. That’s the pattern the rest of this article explains.
The three mechanisms that cause crypto correlation
Three forces, working together, produce the correlation you see on the charts every day.
Mechanism 1: Bitcoin dominance
Bitcoin isn’t just the biggest crypto. It’s close to 58% of the entire crypto market by size, a metric usually called Bitcoin dominance — Bitcoin’s percentage of total crypto market capitalization.
That fact alone does a lot of work.
When Bitcoin moves 5%, the total crypto market cap mechanically moves too, because Bitcoin is most of the market cap. Traders and algorithms treat Bitcoin as the benchmark asset for the whole category — the way the S&P 500 is the benchmark for U.S. stocks. When BTC drops, three things happen fast:
- Automated trading algorithms react to Bitcoin first, then rotate through altcoins within minutes.
- Retail traders sell altcoins to hold BTC during crashes, because Bitcoin is perceived as the safer end of the crypto risk spectrum.
- Sentiment cascades. If BTC is dropping, the assumption is that the whole market is dropping, and behavior follows.
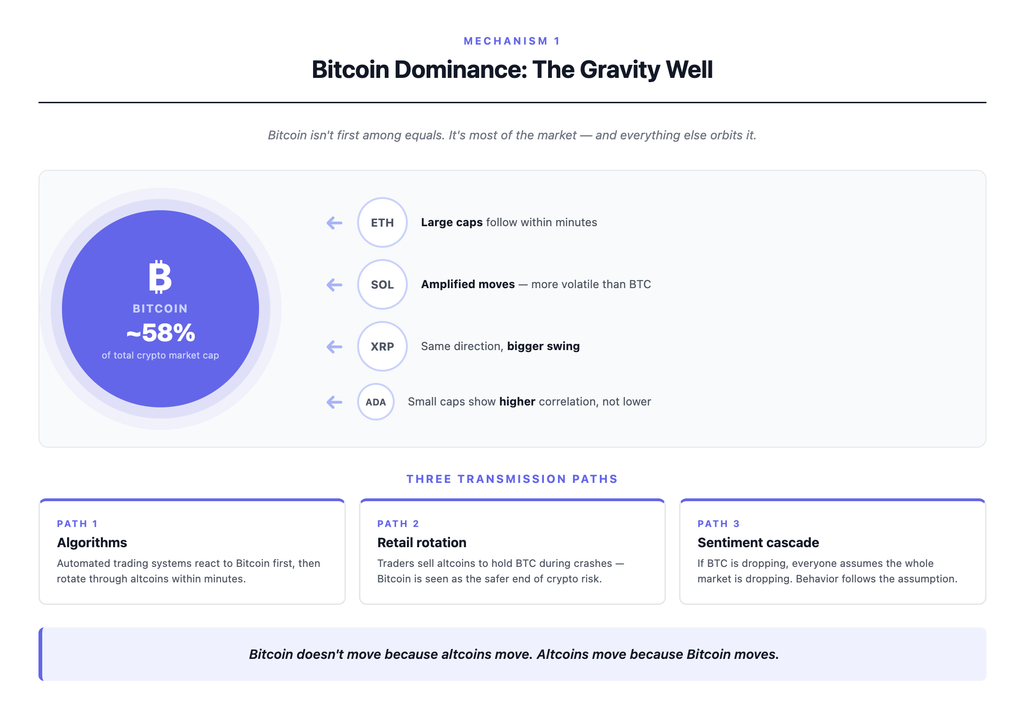
Here’s the important framing: Bitcoin doesn’t move because altcoins move. Altcoins move because Bitcoin moves. The relationship isn’t a partnership — it’s a gravity well.
If you want to check where market attention is concentrated at any given time, Bitcoin dominance is the single most useful number. When it rises, capital is flowing toward Bitcoin. When it drops, capital is spreading to altcoins.
Mechanism 2: Leverage cascades
Most active crypto trading uses leverage — borrowed money that amplifies the size of a position. If you put up $1,000 with 10x leverage, you’re controlling $10,000 worth of Bitcoin. Small price moves become big gains or big losses.
The catch: when prices move against a leveraged position past a certain threshold, the exchange automatically closes it. That’s called a liquidation, and it means forced selling — the exchange dumps the position onto the market to protect itself.
Now imagine thousands of leveraged long positions on Bitcoin. Price starts to drop. Some of them get liquidated. Those liquidations create more selling pressure. Price drops further. More liquidations trigger. The cascade feeds itself.
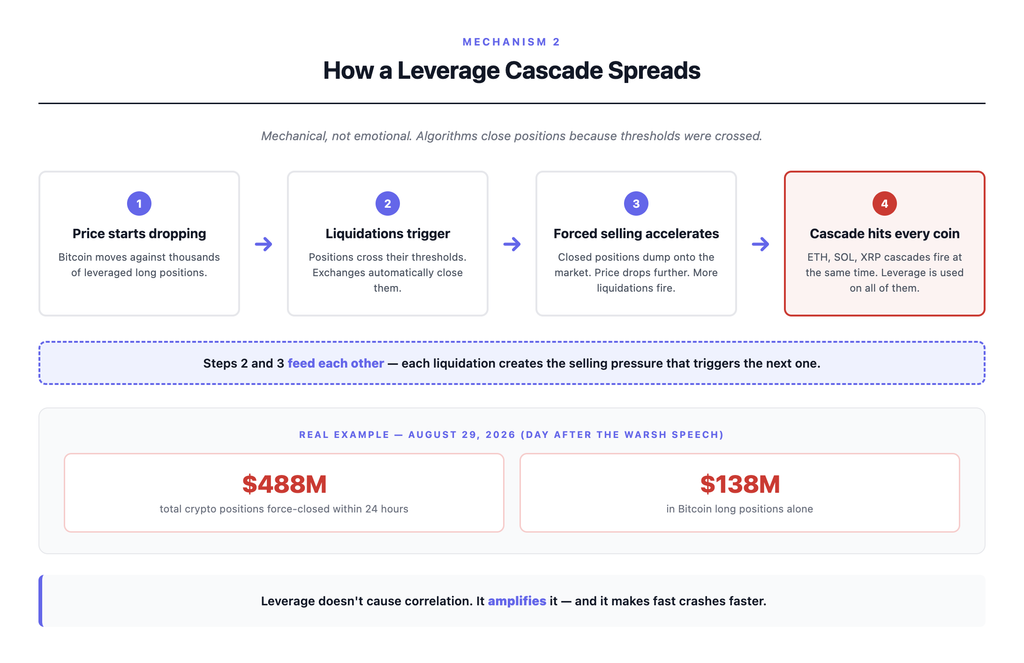
Real example: On August 29, 2026 — the day after the Warsh speech — roughly $488 million in crypto positions were force-closed within 24 hours, including about $138 million in Bitcoin longs alone.
Two things about leverage cascades matter for correlation:
- They happen across all major coins simultaneously, because leverage is used on all major coins. When the BTC liquidation cascade fires, the ETH, SOL, and XRP cascades fire at the same time.
- They’re mechanical, not emotional. The selling isn’t caused by anyone deciding altcoins have bad fundamentals. It’s algorithms closing positions because thresholds were crossed. Individual project quality is irrelevant to the machine.
Leverage doesn’t cause correlation on its own. It amplifies it — and it makes fast crashes faster.
Worth naming the risk here inline: leveraged crypto trading is one of the fastest ways to lose money in the market. Not “risky.” Regularly wipes out entire accounts in a single afternoon.
Mechanism 3: Macro sentiment
The third mechanism is the biggest change of the last few years, and it’s the reason “crypto is uncorrelated with stocks” is no longer true.
Institutional traders — hedge funds, asset managers, prop trading desks — now classify crypto as a risk-on asset. That’s a category that includes tech stocks, high-yield bonds, and emerging market currencies. When investors feel optimistic, they buy risk-on assets. When they feel cautious, they sell all of them at once.
The trigger for the whole category is macro news, and the biggest source of macro news is the U.S. Federal Reserve.
- Dovish Fed signals (lower rates, more liquidity) → risk-on → stocks rally, crypto rallies, high-yield debt rallies.
- Hawkish Fed signals (higher rates, tighter policy) → risk-off → stocks sell, crypto sells, high-yield debt sells.
The August 28, 2026 Warsh speech is the cleanest recent example. One Fed Chair speaking hawkishly at Jackson Hole triggered a same-day selloff in both equities and crypto. Same catalyst, same reaction, different asset classes.
Bitcoin doesn’t move because altcoins move. Altcoins move because Bitcoin moves. The relationship isn’t a partnership — it’s a gravity well.
Alt season: when correlation temporarily breaks
There’s one recurring exception to the “everything moves with Bitcoin” pattern, and it has a name: alt season.
What alt season actually is
Alt season is a stretch of weeks or months when altcoins consistently outperform Bitcoin. Bitcoin might be flat or grinding sideways, while Ethereum, Solana, and smaller altcoins run hard. Bitcoin dominance drops as capital rotates out of BTC and into everything else.
The clearest historical example is the window from late Q4 2020 through Q1 2021. Bitcoin was roughly flat over long stretches while many altcoins gained anywhere from 5x to 20x. That’s alt season.
Why it happens
Alt seasons follow a pattern. Bitcoin runs first in a bull market. Then, once BTC feels expensive or stalls, capital rotates into larger altcoins like Ethereum. From there, it rotates into mid-caps, then small-caps, chasing bigger percentage moves. Bitcoin dominance drops the whole way down.
How to recognize it (and why timing it is hard)
Common alt season indicators:
- Bitcoin dominance falls below roughly 45%.
- Bitcoin price consolidates — not falling sharply, not ripping higher.
- Individual altcoin narratives start getting traction outside crypto Twitter.
But here’s the honest part: alt seasons are late-cycle phenomena. They tend to appear near market tops, not near market bottoms. The euphoria that fuels a running altcoin rotation is the same euphoria that precedes serious corrections. Chasing alt season = often chasing tops.
What alt season teaches about crypto correlation
Notice what alt season doesn’t do. It doesn’t decouple altcoins from Bitcoin. What actually happens is the slope of the relationship changes — altcoins move up faster than Bitcoin does. When the cycle turns, correlation returns immediately, and altcoins drop faster than Bitcoin does too. Alt season doesn’t break correlation. It just changes which direction the relationship favors.
Alt season temporarily changes which coins lead. It doesn’t break the fundamental fact that crypto trades as a category.
Crypto and the stock market: the new correlation
This is the shift that most beginner content hasn’t caught up to.
The old story: crypto was uncorrelated
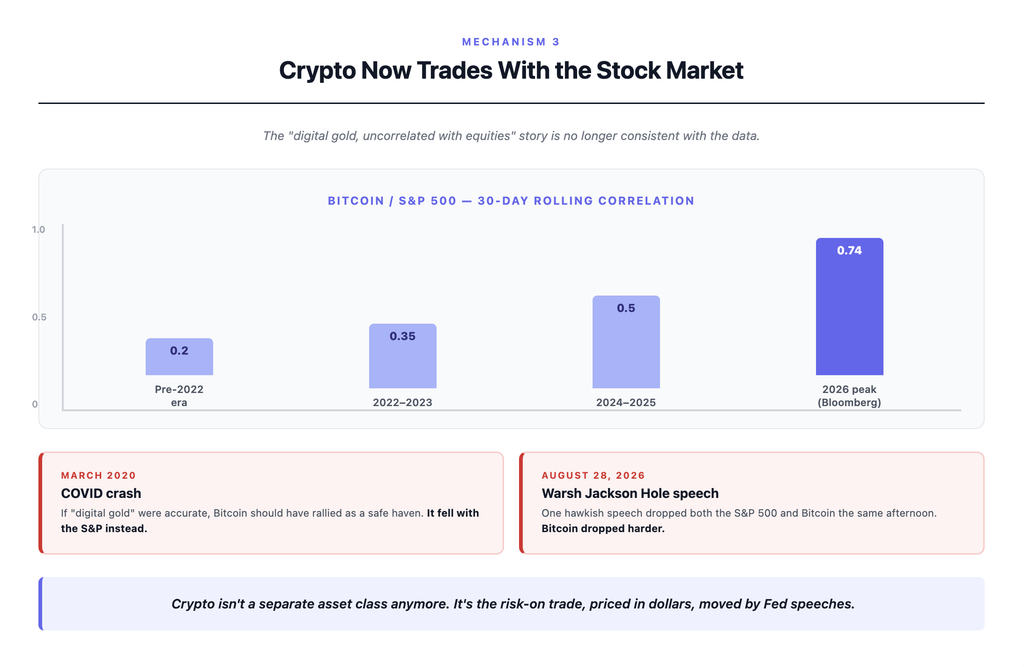
For the first decade of crypto’s existence, the pitch was appealing: Bitcoin was uncorrelated with traditional markets. When stocks dropped, Bitcoin might rise. When bonds struggled, Bitcoin could hold up. That was the “digital gold” narrative, and for a while it was roughly true — Bitcoin’s correlation to the S&P 500 sat around 0.2 in the pre-2022 era.
The new reality: crypto trades with stocks
That relationship has changed. Bitcoin’s rolling correlation to the S&P 500 has climbed as high as 0.74 in 2026 per Bloomberg data. Research from institutional platforms tracking crypto’s correlation to the S&P 500 shows the coefficient rising steadily over that window.
Two examples make the shift concrete:
- March 2020, COVID crash: Bitcoin dropped alongside stocks in the fastest global selloff in decades. If “digital gold” were accurate, BTC should have rallied as a safe haven. It didn’t. It fell with the S&P.
- August 28, 2026, Warsh speech: One hawkish speech, and both the S&P 500 and Bitcoin dropped on the same afternoon. Not similar magnitudes — Bitcoin dropped harder — but same direction, same catalyst.
Why this changed
Institutional adoption. That’s the entire answer.
When crypto was mostly retail traders on Coinbase, it responded to crypto-specific sentiment. Now that hedge funds, ETF issuers, and pension allocators hold Bitcoin and Ethereum, crypto sits inside the same portfolios as tech stocks and high-yield debt. When those funds de-risk, they sell everything in the risk-on bucket, including crypto. Institutional plumbing has pulled crypto into the broader macro trade.
What this means for portfolio thinking
If you’re holding stocks and buying Bitcoin because you were told it diversifies you from equity risk — that pitch is out of date. Bitcoin now often acts as a leveraged version of the same risk-on trade the S&P 500 represents. When stocks are having a bad day, Bitcoin is usually having a worse one.
Crypto isn’t a separate asset class anymore. It’s the risk-on trade, priced in dollars, moved by Fed speeches.
Why diversifying across cryptos is mostly an illusion
Here’s where the load-bearing point of this article lives.
The intuitive move for beginners is: “I don’t know which crypto will win, so I’ll buy ten different ones to spread risk.” That feels responsible. That feels like diversification.
The correlation math says it isn’t.
Diversification works when the assets in a portfolio have low or negative correlation with each other. If asset A drops when asset B rises, your portfolio’s overall volatility is lower than either asset alone. That’s the whole benefit — smoother ride, less concentrated risk.
But if you buy Bitcoin, Ethereum, Solana, Cardano, and XRP — five assets that regularly show 0.7 to 0.9 correlation with each other — your portfolio’s volatility is roughly the same as owning just Bitcoin. You’ve added tickers, not diversification. When the crypto market has a bad week, all five drop together. When it has a great week, all five rise together. The math treats them as one position.
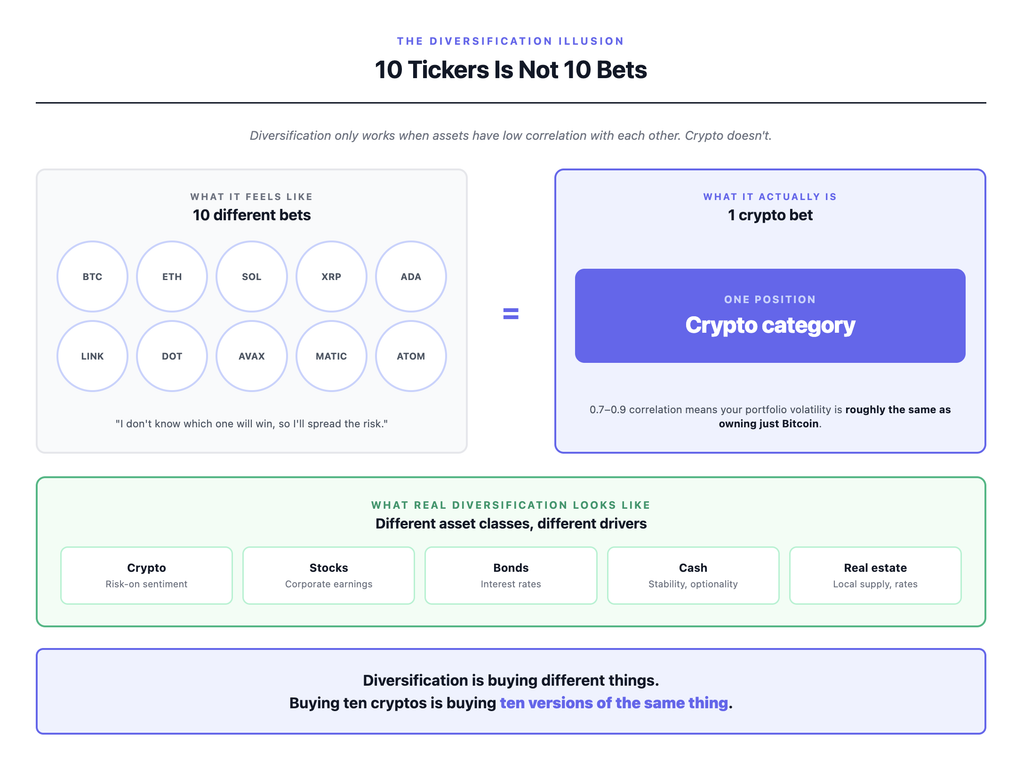
When you own 10 different cryptos, you don’t have 10 different bets. You have 10 different tickers of the same bet.
Real diversification requires different asset classes with different drivers — crypto, stocks, bonds, cash, real estate. Each responds to different economic conditions. Owning ten cryptos is category-level concentration dressed up in the vocabulary of risk management. Understanding this doesn’t mean you shouldn’t own crypto. It means you shouldn’t tell yourself owning several coins is protection. It isn’t.
What this means for beginners
Six practical rules that follow from everything above:
- Owning multiple cryptos is not diversification. It’s the same bet in different colors.
- When Bitcoin runs 5%, most altcoins run 5–15% — with more volatility on the way up.
- When Bitcoin drops 5%, most altcoins drop 5–15% — with more pain on the way down.
- When macro news breaks — FOMC, jobs reports, Jackson Hole, major Treasury announcements — expect the whole crypto market to move. Not “some coins.” All of them.
- If you want actual portfolio diversification, add non-crypto assets. Stocks, bonds, cash. Different drivers, different reactions.
- Watch Bitcoin dominance as a market health signal. Rising dominance = capital consolidating in BTC. Falling dominance = capital rotating to altcoins (which historically means late-cycle behavior).
None of these rules require complex math. They just require accepting that crypto is a category, not a collection of independent bets.
Common misconceptions worth naming
Five clean ones to demolish, then a closer.
“Altcoins move independently of Bitcoin.” Wrong. Most major altcoins show 0.7–0.9 correlation with Bitcoin over any given 30-day window. Independent moves happen — usually driven by coin-specific news — but they’re the exception, not the rule.
“Owning ten different cryptos means I’m diversified.” Wrong. High correlation means you’re concentrated in one bet across ten tickers. Your portfolio volatility barely differs from holding just Bitcoin.
“Crypto is uncorrelated with stocks.” That was roughly true a decade ago. Not now. The BTC/S&P 500 correlation has climbed to as high as 0.74 in 2026, and simultaneous macro-driven selloffs happen regularly.
“Alt season means correlation breaks permanently.” Wrong. Alt season changes the slope of the relationship, not its existence. Correlation returns — usually with a market-wide correction.
“Small-cap altcoins move more independently than large-caps.” Almost always wrong. Small-caps typically show higher correlation to Bitcoin, not lower, and they amplify BTC’s direction in both directions. They’re more, not less, exposed to the same catalysts.
And one closing observation: crypto traders watch each other. When Bitcoin drops, traders sell altcoins in anticipation of altcoin drops. That behavior creates the very correlation people are trying to avoid. The herd knows the pattern, so the herd reinforces the pattern.
How to read crypto correlation honestly
Three checks that turn everything above into a habit:
- Recognize alt season for what it is. Late-cycle rotation, not a regime change. It ends, usually badly.
- Study the leverage picture. High open interest in leveraged positions means correlation amplification is loaded up. When cascades hit, they hit everything.
- Ask the honest question about any position: “If Bitcoin drops 20% overnight, what happens to this?”
That last question is the whole game.
Common questions
Why do most crypto prices move together?
Three mechanisms drive it. Bitcoin dominance — BTC is close to 58% of the total crypto market cap, so its moves mechanically move the market. Leverage cascades — automatic liquidations force simultaneous selling across coins whenever prices cross certain thresholds. Macro sentiment — crypto is now treated as a risk-on asset, so Fed decisions and stock market moves affect the whole category at once.
Do all cryptocurrencies move in the same direction?
Most days, yes. Major cryptos typically show 0.7–0.9 correlation over 30-day windows. Exceptions happen during alt season, when altcoins temporarily outperform Bitcoin, or when a specific coin has news big enough to override the market pattern (a major protocol failure, a specific regulatory ruling, a major exchange listing or delisting).
Is Bitcoin correlated with the stock market?
Increasingly, yes. Bitcoin’s correlation to the S&P 500 rose from roughly 0.2 pre-2022 to as high as 0.74 in 2026. When the Fed signals hawkishly, both crypto and stocks tend to sell off together. When macro sentiment turns risk-on, both tend to rally together. The old “digital gold, uncorrelated with equities” narrative is not consistent with recent data.
What is alt season?
A stretch of weeks or months when altcoins consistently outperform Bitcoin. Bitcoin dominance drops as capital rotates from BTC into Ethereum, then mid-caps, then small-caps. Alt seasons are late-cycle phenomena that often appear near market tops — they change which coins lead, but they don’t break correlation. When the cycle turns, altcoins fall harder than Bitcoin, not less.
Does diversifying across multiple cryptos reduce risk?
Not meaningfully. Because most cryptos have 0.7–0.9 correlation with Bitcoin, owning ten cryptos gives you roughly the same risk profile as owning just Bitcoin. Real diversification requires different asset classes — combining crypto with stocks, bonds, cash, or real estate — because those respond to different economic conditions. Ten crypto tickers is not ten different bets.
Where to go from here
If you want to keep building the mental model:
- What is Bitcoin — the coin that leads all others, and why its supply mechanics matter for correlation.
- What is market cap in crypto — how coin sizing shapes market gravity.
- Dollar-cost averaging in crypto — the strategy that works despite correlation, not because of it.
- How to buy crypto safely — practical entry point if you’re still setting up.
- What is a DEX — for understanding the liquidity mechanics that make cascades possible.
A note on financial advice
Nothing in this article is financial advice. It’s context for making your own decisions.
Correlation introduces specific risks worth naming directly. Assuming crypto diversifies you from stocks — it doesn’t, not the way it did five years ago. Assuming altcoins diversify you from Bitcoin — they don’t, especially not when it matters. Treating “I own ten cryptos” as risk management — it isn’t. Chasing alt season near a market top — the historical record here is unkind.
Crypto is volatile. Individual positions can go to zero. Correlation makes all positions vulnerable to the same catalysts at the same time.
Diversification is buying different things. Buying ten cryptos is buying ten versions of the same thing.
Understanding correlation doesn’t remove crypto risk. It just makes clear which risks you’re actually taking. Everything else is fooling yourself.