Every crypto app shows you a price. Almost none of them show you whether you can actually get it.
This article covers what liquidity in crypto actually means, how it differs from trading volume, why slippage happens, and why a surprising amount of the volume you see reported on exchanges isn’t real. If you’ve ever placed a buy order and ended up paying more than the price on the screen — or tried to sell into a falling market and watched your fill get progressively worse — this is the mechanic behind it.
I’ve been using crypto since 2017, and the first time I placed a real order on a small altcoin, I got a fill noticeably worse than the price I clicked. I thought the exchange had cheated me. It hadn’t. I just didn’t understand that the number on the screen was a snapshot of the last trade, not a promise about the next one. That gap — between what you see and what you get — is the whole subject of this article.
TL;DR
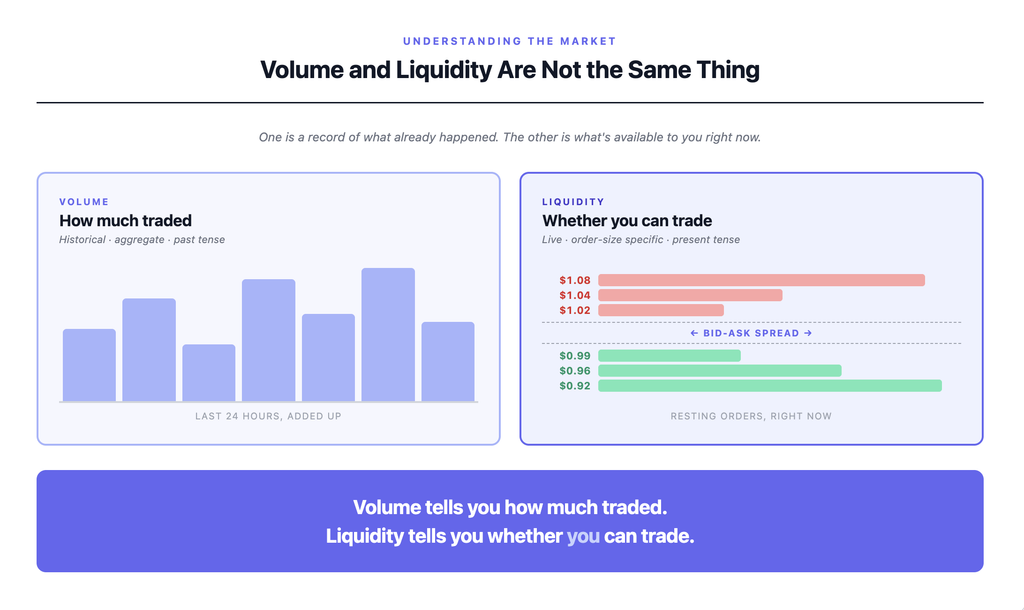
- Volume = how much traded over a period. Liquidity = how easily you can trade now without moving the price.
- High volume doesn’t guarantee liquidity. A coin can trade a lot and still be hard to exit.
- Slippage is the gap between the price you saw and the price you got. Thin liquidity is why it happens.
- The order book is where liquidity actually lives — the stack of resting buy and sell orders.
- Bid-ask spread is the fastest liquidity check you have. Wide spread means thin book.
- Exchanges self-report volume, and some inflate it. Wash trading is real and measurable.
- Liquidity matters most on the way out, which is when beginners discover they don’t have it.
So what is liquidity in crypto, in one sentence?
Liquidity in crypto is how easily you can buy or sell an asset at close to its quoted price — a measure of whether the market can absorb your order without moving against you, which is a different question from how much that asset has traded.
That’s the whole thing. Everything else in this article is unpacking why that distinction costs people money.
What crypto trading volume actually measures
Crypto trading volume is the total value or quantity of an asset that changed hands over some period, almost always the last 24 hours by default. When CoinGecko or CoinMarketCap show you a coin’s “24h Volume,” they’re adding up every reported trade across the exchanges they track.
What the number counts
Volume counts completed trades. Somebody bought, somebody sold, the exchange matched them, and the size of that trade got added to the running total. It doesn’t matter whether those two people were retail traders, algorithms, market makers, or the exchange itself trading against itself. A trade is a trade, as far as the volume figure is concerned.
Where it comes from
Every centralised exchange reports its own volume. Aggregators like CoinGecko and CoinMarketCap collect those reports, apply their own filters, and publish combined numbers. Nobody audits this in the way public company financials get audited. That’s important, and we’ll come back to it.
What high volume genuinely signals
Volume tells you real things — just narrower things than most beginners assume. High volume means people are paying attention. It means the asset is trading at all, which is a genuine question for the long tail of small tokens. It means news, or a listing, or a price move has drawn activity in. Those are useful signals.
What volume doesn’t tell you is whether that activity is spread evenly across the day, whether it’s real participants or wash trades, or whether any of it is available to you when you go to trade. A single large block trade at 3am can dominate a coin’s 24-hour figure. The number is a historical aggregate. Your order is happening in the present tense.
That distinction matters more than it sounds. Which brings us to liquidity.
Liquidity is a different question
Liquidity asks: right now, can I convert this asset to cash — or vice versa — at close to the quoted price, and how much can I move before the price moves against me?
To answer that, you need to look at the order book.
The order book, plainly
On a centralised exchange, every asset has an order book. It’s a two-sided list. On one side, resting buy orders — bids — stacked from the highest price a buyer is willing to pay downward. On the other, resting sell orders — asks — stacked from the lowest price a seller will accept upward. The gap between the highest bid and the lowest ask is the bid-ask spread.
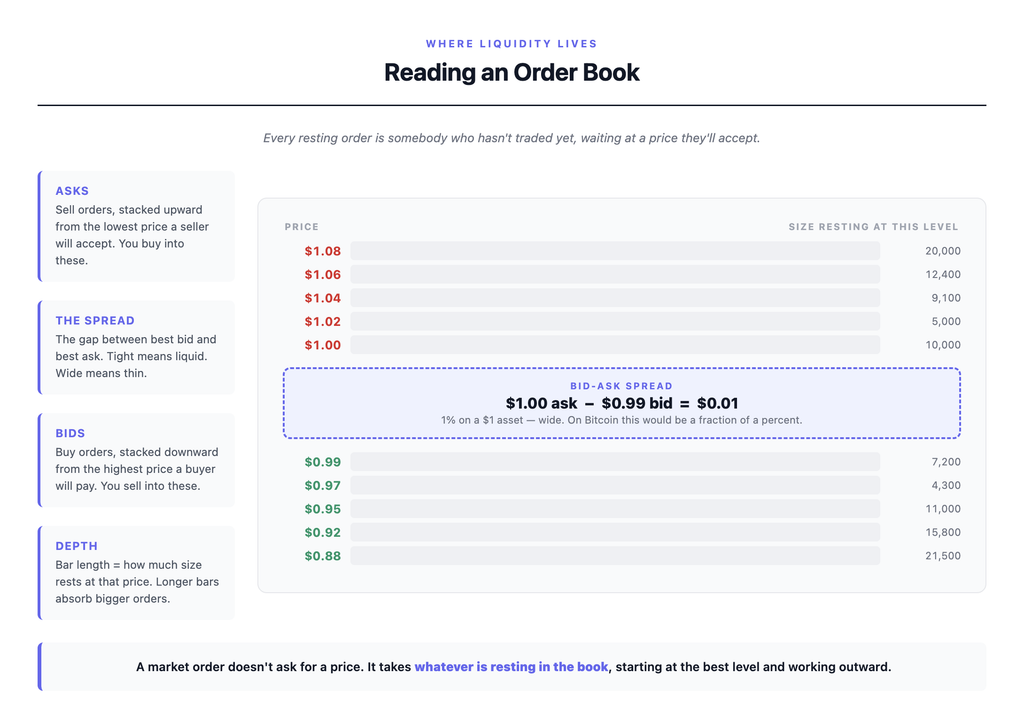
When you place a market order, you’re not asking for a price — you’re asking to be filled immediately at whatever’s sitting in the book. A market buy consumes asks starting from the lowest and works its way up. A market sell consumes bids starting from the highest and works its way down.
Market depth
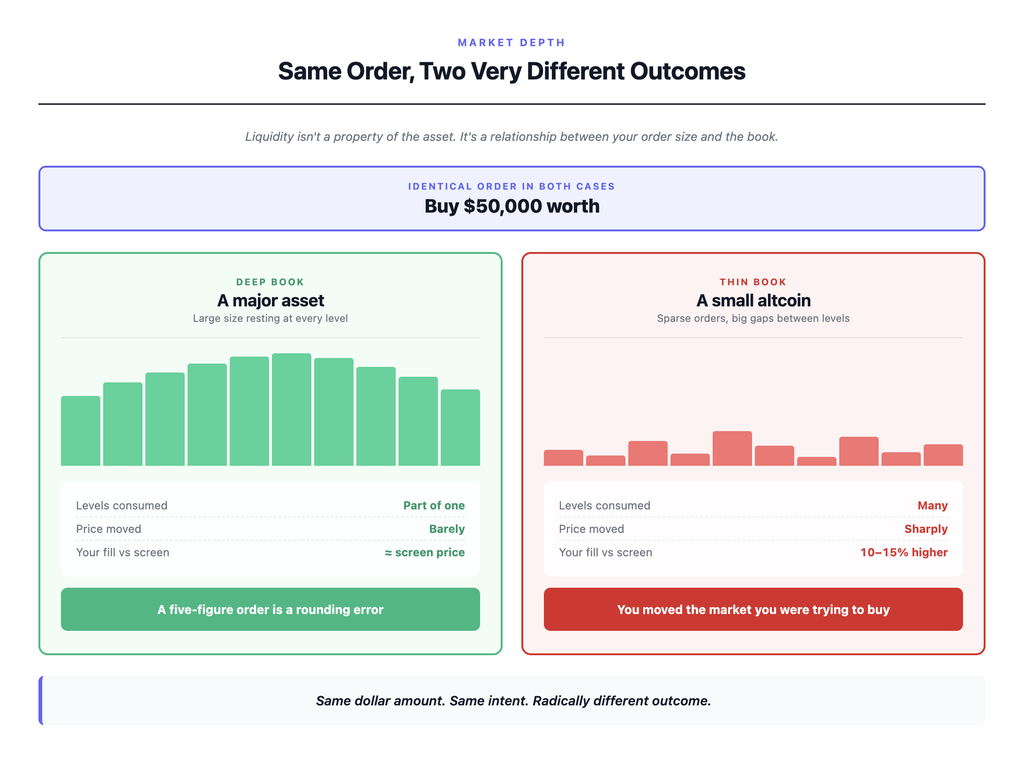
Market depth is how much volume is resting at each price level. A deep book has large orders stacked close together — meaning a big incoming order gets filled with little price movement. A thin book has small orders spread across a wide price range — meaning the same incoming order eats through several levels and gets progressively worse fills.
Deep = your order barely moves the price. Thin = your order moves the price against you.
Same order, two different assets
Picture the same $50,000 buy order on two different coins.
On Bitcoin, that $50,000 disappears into the top of the book. The fill lands within a fraction of a percent of the quoted price. Bitcoin’s book is deep enough that a five-figure order is a rounding error.
On a thin altcoin — say something with a $10 million market cap trading mostly on one venue — that same $50,000 might eat through the entire top ask level, then the next, then the next. Your average fill price could land 10–15% above where you started. Same dollar amount, same intent, radically different outcome.
Why volume and liquidity diverge
Volume is historical and aggregate. It tells you what already happened, added up. Liquidity is present-tense and specific to your order size. A coin can post a big 24-hour volume figure because one whale made two large trades — and still have almost nothing resting in the book right now, when you want to trade.
Volume tells you how much traded. Liquidity tells you whether you can trade.
Slippage — where thin liquidity actually costs you
Slippage is the difference between the price you expected and the price you got. It’s the direct, measurable cost of thin liquidity.
What slippage is
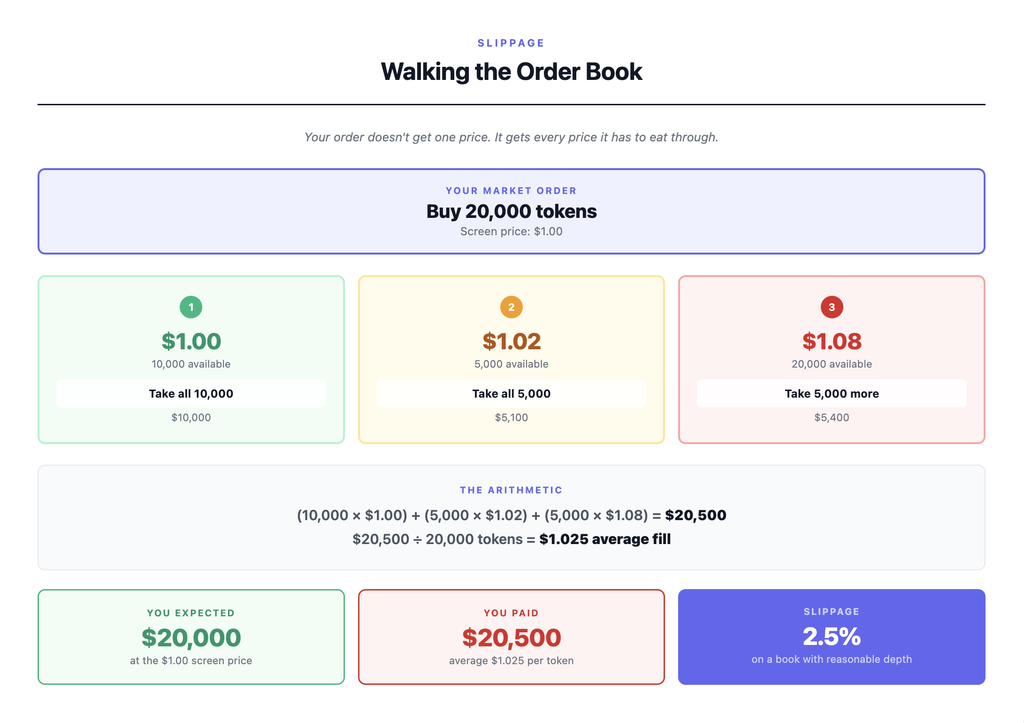
You see a token quoted at $1.00. You place a market buy for 20,000 tokens. You expect to spend $20,000. Your fill comes back with an average price of $1.05, and you spent $21,000. That extra $1,000 is slippage. Nobody cheated you — the book just didn’t have 20,000 tokens available at $1.00.
Slippage matters enough that it’s how the industry measures liquidity in the first place. CoinMarketCap’s Liquidity Score works by simulating buy and sell orders from $100 up to $200,000 against a real order book and recording how much slippage each one produces — weighted toward the smaller sizes, because that’s what most people actually trade.
Walking the book
Here’s the mechanism, with numbers.
Say the ask side of the book looks like this:
- 10,000 tokens available at $1.00
- 5,000 tokens available at $1.02
- 20,000 tokens available at $1.08
Your 20,000-token market buy consumes all 10,000 at $1.00, then all 5,000 at $1.02, then 5,000 of the tokens sitting at $1.08. The math: (10,000 × $1.00) + (5,000 × $1.02) + (5,000 × $1.08) = $20,500 for 20,000 tokens. Average fill: $1.025. Slippage: 2.5%.
That’s on a book with reasonable depth. On a genuinely thin book, or in a fast market where orders are being pulled as you trade, it gets much worse.
Why exits are worse than entries
Slippage on the way in is annoying. Slippage on the way out is where real money disappears.
When a market is falling, bids get pulled and repriced downward faster than new bids come in. Panic selling hits a book that’s actively thinning. Every large market sell walks further down the book than it would have moments earlier. Fills get progressively worse. This is why crashes cascade — forced sellers push prices lower, which triggers more forced selling, which pushes prices lower again.
The August 29, 2026 liquidation cascade is a case study: roughly $488 million in leveraged positions force-closed in 24 hours, including about $138 million in Bitcoin longs. Forced selling into thinning books is slippage at industrial scale, and it’s what turns an ordinary down day into a violent one.
What you can control
The tools you actually have:
Limit orders let you specify the worst price you’ll accept. A limit buy at $1.02 won’t fill above $1.02 — but it might not fill at all if the price runs away. You trade certainty of price for uncertainty of execution.
Slippage tolerance on decentralised exchanges is a version of the same idea. You set a maximum acceptable slippage — say 1% — and if the fill would exceed it, the transaction reverts. This protects you from getting sandwiched or filled at absurd prices, at the cost of failed transactions when markets move.
Order sizing is the underrated one. Splitting a large order into smaller pieces over time lets more of it interact with fresh liquidity coming into the book, rather than blowing through everything resting.
Trading with leverage massively amplifies all of these problems — a small slippage on a highly leveraged position can move you from profit to liquidation in seconds.
The price on the screen is what someone else just paid. It is not a quote. It is not a promise. It is history.
Where the volume numbers come from — and why some are fake
Exchanges self-report volume to aggregators. There is no independent audit. Which raises an obvious question: what stops an exchange from making the numbers up?
Mostly, nothing.
Wash trading
Wash trading is buying and selling to yourself — or coordinating with a related party — to inflate reported volume without any real economic exchange. Two accounts, controlled by the same entity, trading the same asset back and forth. Every “trade” gets added to the volume figure. Nobody actually moved capital.
Exchanges do this for a few reasons. Higher reported volume moves them up rankings on aggregator sites. It helps them charge listing fees to new projects that want to appear on a “high-volume” venue. It creates the appearance of a liquid market, which attracts more real traders. The incentives to inflate are strong, and enforcement is weak.
Projects do it too, on their own tokens, to look more traded than they are.
The scale of this is worth naming. In 2019, asset manager Bitwise submitted research to the SEC arguing that roughly 95% of reported Bitcoin trading volume was fake, and that only around ten exchanges were reporting figures you could trust. That report is the reason the adjusted metrics discussed below exist at all. The data is from 2019 and the market has cleaned up since — but the incentive structure that produced it hasn’t changed.
How to spot it
You can’t fully verify from the outside, but the tells are:
- Volume wildly disproportionate to order book depth. A coin claiming $50 million in daily volume with only $20,000 of resting orders at each side of the book is not adding up.
- Round-number patterns. Suspicious clumping of trades at exact intervals or exact sizes.
- Volume without price movement. Real volume tends to move price, at least a little. Volume that stays perfectly flat with a stable price is often synthetic.
- Concentration on one obscure venue. A coin that trades $100 million a day but only on a single exchange nobody has heard of should raise eyebrows.
What aggregators do about it
CoinGecko publishes a Trust Score that grades exchanges across liquidity, regulation, cybersecurity, operational history and proof of reserves. Liquidity is the most heavily weighted piece, assessed on whether an exchange’s reported volume is consistent with a trusted benchmark set and on how deep its order books actually are. Notably, CoinGecko rebuilt the score in May 2026 specifically to stop relying on web traffic as a proxy and measure volume and depth directly instead. Scores are graded on a curve against other exchanges rather than against a fixed standard, and recalculated weekly.
CoinMarketCap runs a Confidence Indicator, which feeds liquidity data, web traffic and trade-level records into a model that predicts what an exchange’s volume should be — then flags venues reporting far above that prediction. Notably, the two aggregators disagree about whether web traffic is a useful signal at all.
These are useful. They are not gospel. They’re estimates trying to correct for a problem that the reporting entities have every incentive to obscure.
The honest framing: fake volume is not a fringe issue at the edges of the market. It’s structural. You can’t verify it exhaustively from a phone. What you can do is treat volume figures on small or obscure coins with the skepticism they deserve.
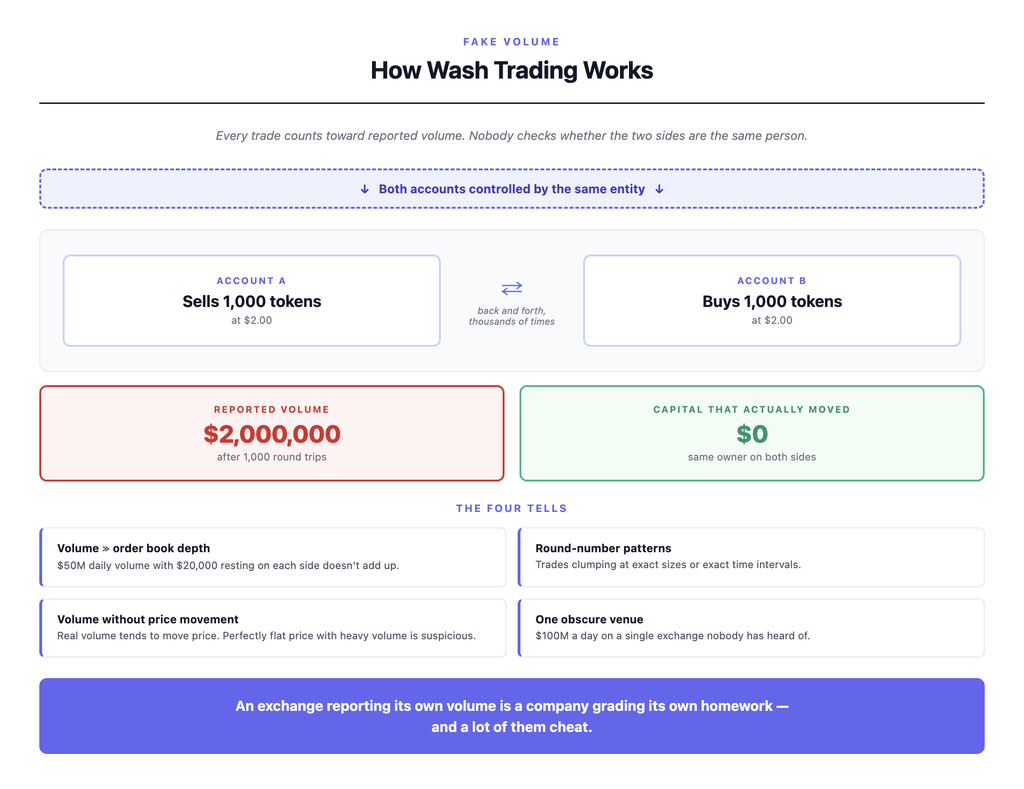
An exchange reporting its own volume is a company grading its own homework, and a lot of them cheat.
Who provides liquidity
Liquidity doesn’t just exist. Somebody puts it there.
Market makers on centralised exchanges are firms — sometimes proprietary trading shops, sometimes hedge funds, sometimes the exchange itself — that continuously quote both a bid and an ask on an asset. Their business model is earning the spread. Institutional research on crypto market structure tracks how this depth behaves across venues and market conditions. Buy at the bid, sell at the ask, capture the difference across thousands of trades. They provide the resting orders you’re trading against.
Liquidity pools on decentralised exchanges work differently. Instead of an order book, an automated market maker (AMM) uses a pool of two assets and a mathematical formula to set prices. Anyone can deposit into the pool and earn a share of trading fees in return. There’s no bid or ask — just the pool ratio, which moves as people trade. This model has its own quirks, including something called impermanent loss, which deserves its own article.
Why any of this matters to a beginner: liquidity is a service someone provides, and they can withdraw it. Market makers on centralised venues widen their spreads sharply during volatility, or step back entirely if they think risk is too high. Liquidity providers on DEXs can pull their capital out of pools. Precisely when you need liquidity most — during a violent move — the people providing it have the strongest reason to reduce or remove it.
The market week of September 8–12, 2026 was a live demonstration, and we covered it in that week’s brief. Roughly $462.6 million left US spot Bitcoin ETFs across four trading days, with zero inflow days. That figure is about 0.5% of the roughly $97.5 billion those ETFs held. Half a percent of one product’s holdings pushed Bitcoin from $81,427 to roughly $76,000 — around a 6% drop over the week.
That’s not a volume story. Volume was high. That’s a liquidity story. The order books couldn’t absorb the selling without price concessions. Why do crypto prices move together
How to check liquidity before you buy
Before you commit real money to a position, especially in anything smaller than the top few dozen coins by market cap, run these checks:
1. Check the bid-ask spread. On the exchange you’re actually using, look at the top of the order book. A tight spread — hundredths of a percent on Bitcoin, small single-digit basis points on major coins — means a liquid market. A spread of 1%, 5%, or more means thin liquidity. This is the fastest single check available and takes about ten seconds.
2. Look at order book depth, not just the top line. Most exchanges show a depth chart — a visualisation of how much size sits at each price level away from the current price. A steep, tall depth chart on both sides means the book can absorb size. A flat, sparse chart means it can’t.
3. Compare volume to market cap. If a coin’s 24-hour volume is a huge fraction of its market cap — say 50% or more — that’s either extraordinary organic activity or wash trading. Combined with other warning signs, it usually points to the latter.
4. Check volume across exchanges. Real, liquid assets trade meaningfully on multiple venues. Volume concentrated on one obscure exchange is a warning, not a feature.
5. Test with a small order first. Place a small buy, watch how it fills, then place a small sell and watch that fill. The difference between the two prices — plus any slippage you observed — tells you more about real liquidity than any figure on an aggregator page.
6. Ask the exit question. “If I needed to sell all of this tomorrow morning, who would be buying?” If you can’t name the buyer, you don’t have liquidity — you have a position and a hope.
Common misconceptions worth naming
“High volume means I can sell easily.” Wrong. Volume is historical and aggregate. Your exit depends on what’s resting in the book at the moment you place your order.
“The price I see is the price I’ll get.” Wrong. The price displayed is the last completed trade. Your fill depends on the book, your order size, and how fast the market is moving.
“Big market cap means good liquidity.” Usually correlated, not guaranteed. A large-cap token with concentrated holdings and thin circulating float can be genuinely harder to exit than the market cap number suggests. What is market cap in crypto
“Exchange volume figures are audited.” Wrong. They’re self-reported. Aggregators estimate and adjust with methodologies like Trust Score, but nobody verifies the underlying trades exhaustively.
“Liquidity only matters to big traders.” Wrong, and backwards. Large traders have execution desks, algorithmic tools, and relationships with market makers to minimise slippage. A retail seller in a panic has a market order and whatever’s left in the book.
The reflexive observation underneath all of this: liquidity is most abundant when nobody needs it and disappears when everyone does. Market makers widen spreads in volatility. Liquidity providers pull capital when volumes spike the wrong way. The moment a crowded exit forms is the exact moment the book thins.
How to think about liquidity honestly
Three questions to carry with you:
1. Size your position to the exit, not the entry. Getting in is easy — someone is always willing to sell you something. Getting out, especially in size, especially under stress, is the harder problem. If you couldn’t sell your full position in a bad week without moving the price significantly against yourself, you own more than you think.
2. Treat unusual volume as a question, not a signal. A sudden volume spike isn’t automatically bullish or bearish. Ask where it’s concentrated, whether the order book supports it, and whether it moved price the way real volume would.
3. Ask the honest question. “If this drops 30% tomorrow and everyone wants out at once, what happens to my order?”
That last question is the whole game.
Common questions
What is liquidity in crypto?
Liquidity in crypto is how easily you can buy or sell an asset at close to its quoted price. High liquidity means large orders fill with little price movement. Low liquidity means even modest orders push the price against you. It’s a measure of the market’s ability to absorb your trade — a different question from how much the asset has traded over the last 24 hours.
What’s the difference between volume and liquidity?
Volume is how much of an asset traded over a period — usually the last 24 hours, aggregated across exchanges. Liquidity is how easily you can trade right now without moving the price. Volume is historical and aggregate. Liquidity is present-tense and specific to your order size. A coin can post high volume and still have a thin order book at the moment you want to trade.
What is slippage in crypto?
Slippage is the difference between the price you expected when you placed an order and the price you actually got when it filled. It happens because your order consumes resting orders at multiple price levels — a mechanic called walking the order book. Thin liquidity, large order size, and fast-moving markets all make slippage worse. Limit orders and slippage tolerance settings are how you cap it.
How can I tell if a crypto has good liquidity?
Fast checks: look at the bid-ask spread on your exchange (tight is good, wide is bad), examine the depth chart on both sides of the book, and compare 24-hour volume to market cap for anything that looks anomalous. Check whether volume is spread across reputable exchanges or concentrated on one obscure venue. For real confidence, place a small test order and observe how it fills.
Is crypto trading volume data reliable?
Partially. Exchanges self-report volume, and there is no independent audit. Wash trading — self-dealing to inflate reported figures — is documented and widespread, particularly on smaller venues and smaller tokens. Aggregators like CoinGecko and CoinMarketCap publish adjusted metrics — Trust Score and the Confidence Indicator — that attempt to correct for it, but these are estimates. Treat volume figures on obscure coins with skepticism.
Where to go from here
Once you understand what liquidity in crypto really is, a lot of market behaviour stops looking mysterious. Cascading crashes, why some coins pump on tiny buys, why exiting a position feels harder than entering it — all of it traces back to what’s in the order book and who’s willing to provide it.
Worth reading next:
- What is market cap in crypto — the other number that looks like it means more than it does
- Why do crypto prices move together — leverage cascades are thin liquidity at scale
- What is a DEX — liquidity pools instead of order books
- How to buy crypto safely — where order types actually live
- What is Bitcoin — the most liquid crypto asset, and why that matters
A note on financial advice
This article is educational. It’s not financial advice. But since liquidity is the thing most beginners get wrong first, a few risks worth naming specifically:
Assuming you can exit at the screen price is the most common mistake. The screen shows the last trade; your fill depends on what comes next. Trusting self-reported exchange volume on small coins, without checking order book depth, is another. Holding a position larger than the book can reasonably absorb is a slower-motion version of the same error — you feel fine until you need to sell, and then you don’t. And discovering liquidity risk during a crash rather than before it is, unfortunately, how most people learn this lesson.
Liquidity is the thing you never notice until the moment you need it most, which is exactly when it disappears.