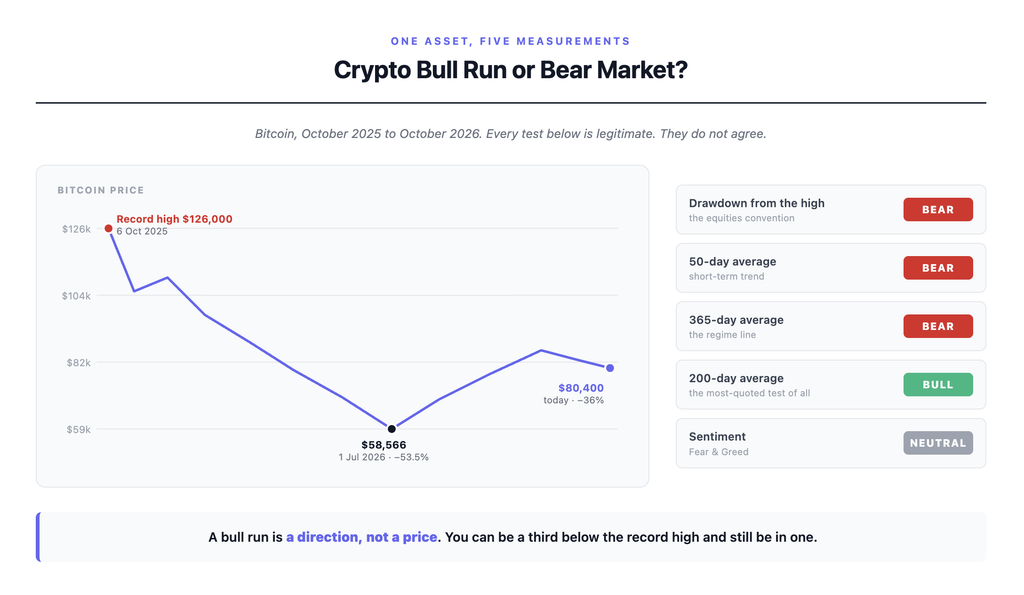
Bitcoin is 36% below its record high. Some sentiment readings say greed, others say fear, and the most-quoted trend line on the chart still points up. All of those are true at the same time, and the words we use to describe markets can’t hold them all at once.
This article covers what “bull run” and “bear market” actually mean, the five tests analysts use to decide which one you’re in, and why those tests currently disagree. It also covers bear market rallies — the sharp rises inside a continuing downtrend that fool almost everyone, almost every time — and crypto winter, which isn’t quite the same thing as a bear market and shows up on none of the price charts.
I’ve been using crypto since 2017, which means I sat through the 2018 bear market without knowing it was one and have watched three separate rallies inside each downturn get called “the bottom.” That taught me one thing worth passing on: the labels are always clearer in the rearview mirror than through the windscreen.
TL;DR
- A crypto bull run is a sustained upward trend, not a price level. A bear market is the same thing pointing down.
- There is no official declaration. Nobody rings a bell. Every “bull market” label is somebody applying a test, and rarely saying which one.
- The five common tests — drawdown from the high, the 50-day average, the 200-day average, the 365-day average and sentiment — currently disagree with each other.
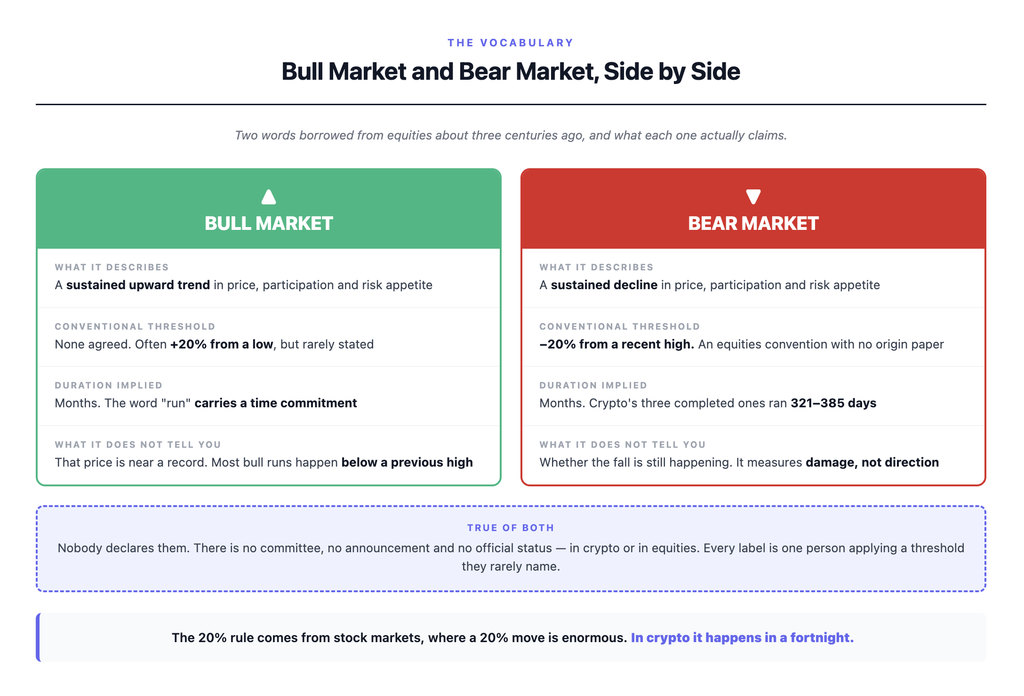
- The 20% rule comes from stock markets, where a 20% move is enormous. In crypto it happens in a fortnight.
- Bear markets contain violent rallies. Historically every one has, and each looked like a recovery at the time.
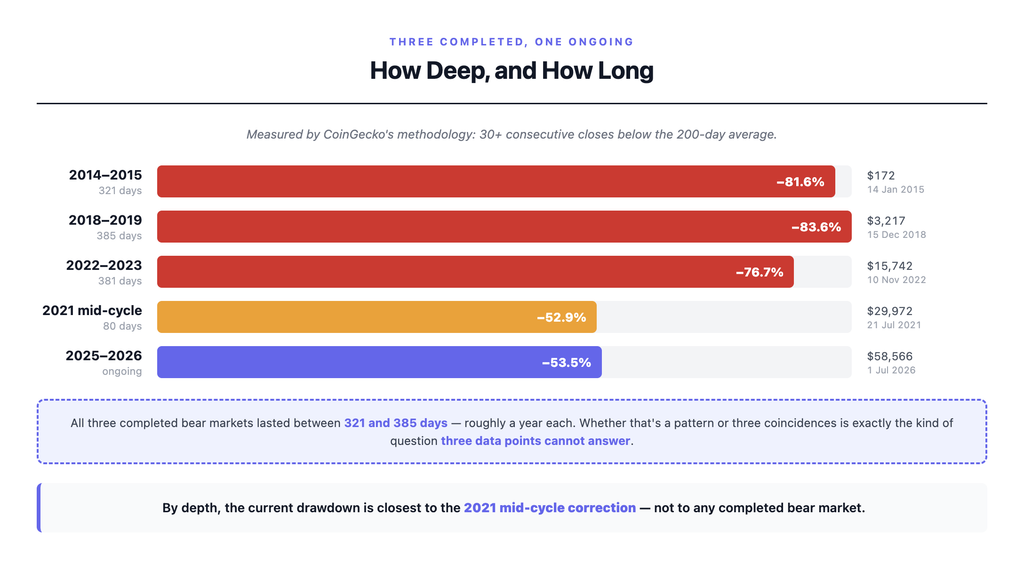
- Crypto’s three completed bear markets ran 321, 385 and 381 days, with drawdowns of 77–84%.
- The current drawdown of about 53.5% at its worst is the shallowest on record — which is either a new regime or an unfinished one.
The one-sentence version
So, what is a crypto bull run in one sentence?
A crypto bull run is a prolonged period of rising prices, rising participation and rising risk appetite — a direction that holds long enough to change how people behave — and a bear market is the same phenomenon in reverse, with the important detail that nobody can tell you which one you’re in without first telling you which test they used.
That last clause is the entire article.
What a bull run actually is
A crypto bull run is a sustained upward trend across months, not a good week. The word “run” is doing most of the work — it implies duration. A 15% rally over five days isn’t a bull run. It’s a rally. A bull run is what you call it when rising prices stop being a surprise and start being the backdrop.
The animals are old: a bull attacks by thrusting its horns upward, a bear swipes downward. The usage predates crypto by about three centuries and arrived wholesale from equities, along with most of the rest of the vocabulary — which is part of why it fits the asset awkwardly.
Price is the obvious signal but not the only one. A proper bull run brings new participants, media coverage turning positive, exchanges hiring, and risk appetite spreading out from Bitcoin into everything else. The direction of travel changes who’s willing to buy, which is what keeps the trend going.
And a bull run does not require a new all-time high. This is the thing most beginners get wrong, and it’s why the labels get confusing. Bitcoin spent most of 2023 and the opening weeks of 2024 well below its 2021 peak, and almost everyone agreed that period was a bull run. The direction mattered more than the altitude. A crypto bull run can begin, continue and end entirely under a previous record.
Hold onto that for the next two sections, because it’s the context that makes today’s disagreement make sense.
What a bear market is, and the 20% rule nobody questions
A bear market is a sustained decline — conventionally, a fall of 20% or more from a recent high.
Where the 20% came from
Nowhere, really. It’s an equities convention — not a law, not derived from anything in particular, just a round number that stuck because round numbers stick. If you go looking for the paper that established it, you won’t find one.
And it travels badly to crypto. Bitcoin has fallen 20% inside a single week repeatedly, often in the middle of what everyone agreed were bull runs. A threshold that fires constantly stops carrying information. Applied literally, crypto would be in a bear market most of the time — which is why nobody applies it literally, and why everyone is quietly using a different test without saying which.
That’s the hidden move in almost every “we’re in a bear market now” claim you’ll read. The 20% number gets cited because it sounds like a definition, then abandoned because nobody actually believes it.
Who gets to declare one
Nobody. Not in crypto, and not really in equities either. The closest analogue in traditional finance is the National Bureau of Economic Research declaring recessions, and it typically takes months of data before doing so — after the fact. Market labels are retroactive by nature. If something is being called a bear market in real time, that’s one person’s judgement, not an official status.
How the last bull run actually ended
Bitcoin set its record high above $126,000 on October 6, 2025. Four days later, roughly $19 billion of leveraged positions were force-closed in 24 hours across 1.6 million trading accounts — the largest liquidation event in crypto’s history.
The speed is the part worth sitting with. CoinGecko’s breakdown shows $6.93 billion liquidated in forty minutes, including $3.21 billion in a single minute at 21:15 UTC. Bitcoin fell from $122,574 to $104,782, down 14.5%. The trigger was a tariff announcement, landing into record open interest of $217 billion.
The top wasn’t marked by euphoria building to a peak. It was marked by a leverage flush. The chart’s highest point and the market’s most violent day were four days apart — a useful corrective to the idea that cycle turns announce themselves. For why a single day could unwind that much, see what is liquidity in crypto.
The five tests, and why they disagree
Ask five reputable analysts whether crypto is in a bull run right now and you will get five different answers, all defensible. That isn’t a scandal. It’s the structural situation.
Here is where the five most-cited tests sit, as of 26 October 2026:
| Test | What it measures | Reading | Verdict |
|---|---|---|---|
| Drawdown ≥20% from the high | Distance from the peak | ~36% below the Oct 6, 2025 high of $126,000 | Bear |
| 50-day moving average | Short-term trend | Price ~$80,400 vs ~$81,800 — broke below on 23 Oct after 66 consecutive closes above | Bear |
| 200-day moving average | Long-term trend (CoinGecko’s methodology) | Price ~10% above, around $72,900 | Bull |
| 365-day moving average | Regime line (CryptoQuant’s measure) | Price ~$80,400, average around $80,500 — below, narrowly | Bear |
| Sentiment | How participants feel | Fear & Greed in the low 40s to mid 50s depending on provider | Neutral |
These readings will change. The argument around them won’t.
Drawdown measures damage — how far the market has fallen from its best moment, and nothing about whether the fall is still happening or stopped three months ago.
The 50-day average is the most common short-term trend test. On 23 October Bitcoin closed $459 below it, ending 66 consecutive closes above. Note that the 50-day was still rising when price broke under it — a trend line pointing up while price sits below it is exactly the ambiguity that makes one indicator a poor basis for a decision.
The 200-day average is the long-term version, and CoinGecko’s bear-market methodology uses it: 30 or more consecutive closes below the line defines a bear market. By that measure we are comfortably in a bull run.
The 365-day average is slower still, and CryptoQuant treats it as the regime line. Bitcoin reclaimed it in late September, then lost it again through October. A test that has changed its answer twice in five weeks is a good argument for not leaning on any single one.
Sentiment measures behaviour rather than value, and it reads worst exactly when it should read best — euphoria tops, panic bottoms. Right now it’s neutral, which under its own logic means no signal at all.
The disagreement isn’t measurement error. It’s structural. The distance between today’s price and a prior peak is a different quantity from the direction price is travelling, and both differ from how participants feel. You can be a long way below a high and heading up. You can be above a long-term average and falling.
A crypto bull run is a direction, not a price. You can be a third below the record high and still be in one. Five reputable sources, five defensible methods, five different answers — the disagreement isn’t a scandal, it’s the honest state of the question.
Crypto winter — the phase that isn’t on the chart
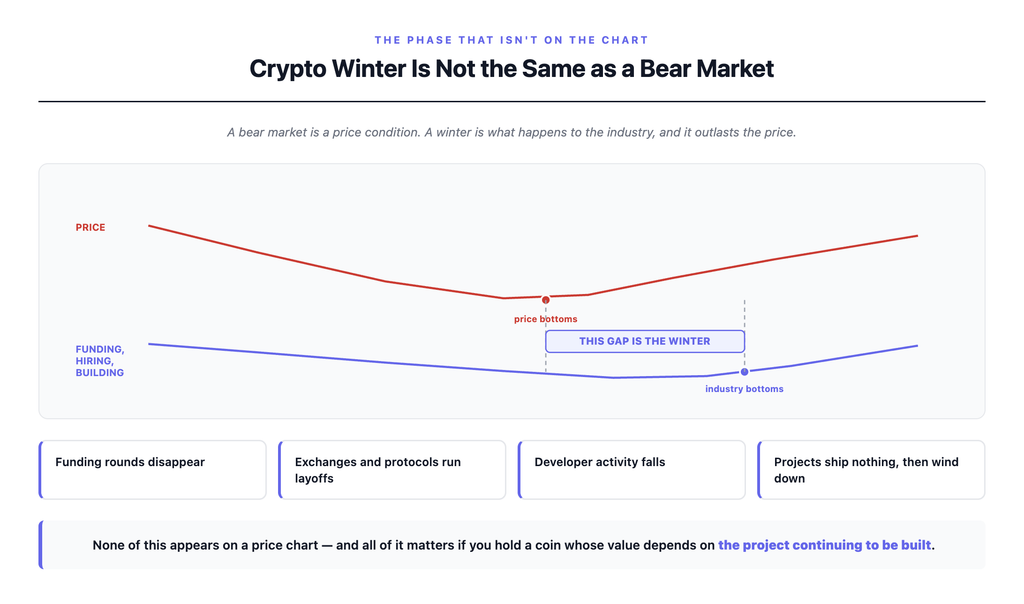
A crypto winter is not simply a deep bear market. It’s a bear market plus a collapse in funding, hiring, attention and building that outlasts the price recovery. The term entered circulation after 2018, borrowed by analogy from “nuclear winter” via tech usage, and it stuck because that downturn made clear price and industry health are different variables.
Price can turn months before the industry does. Both 2018–2019 and 2022–2023 had winters that continued well into the early price recovery — companies kept failing after the bottom was in, because the funding that would have kept them alive had already dried up. The chart stopped falling. The building didn’t restart.
How you’d know you’re in one: funding rounds disappear, exchanges and protocols run layoffs, developer activity falls, and projects you held through the downturn quietly ship nothing for months before winding down. None of that appears on a price chart, and all of it matters if you hold a coin whose value depends on the project continuing to be built.
Is this a crypto winter?
By price alone, this has been the mildest Bitcoin drawdown on record. By industry behaviour it doesn’t look much like a winter either. ETF inflows hit a 2026 weekly record in September, and October has run negative — Bitcoin funds down about $313 million month-to-date, Ether funds approaching a billion. That’s a wobble, not a collapse: the money is still there, it has just stopped arriving every week. Regulators are writing rules rather than retreating.
The honest version: this period has the price pattern of a bear market and the industry pattern of a mid-cycle pause.
Bear market rallies — why the bottom keeps looking like the bottom
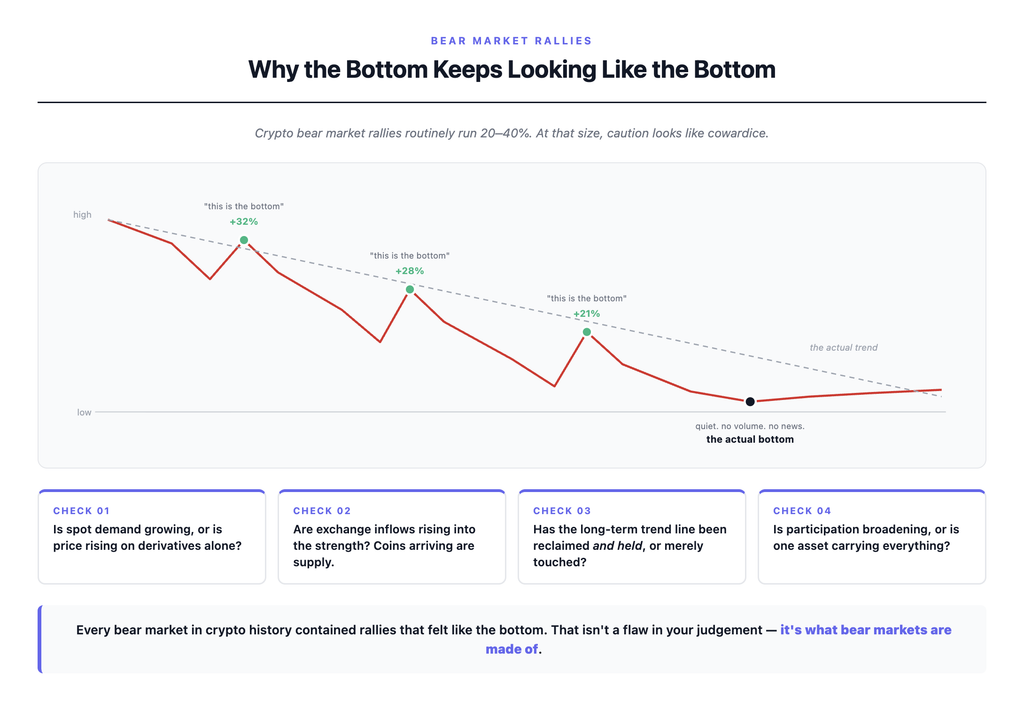
A bear market rally is a sharp, convincing rise inside a continuing downtrend. They deserve their own section because crypto’s are not small — they routinely run 20–40%. At that size, caution looks like cowardice and the people confidently calling the bottom look right. For a few weeks.
A worked example
On January 16, 2026, CryptoQuant argued that Bitcoin’s roughly 21% rally since November 21 was a bear market rally rather than a new bull run. Their reasoning:
- Bitcoin had broken below its 365-day moving average — their regime line, then near $101,000 — and failed to reclaim it.
- Spot demand had contracted by about 67,000 BTC over 30 days, and had been negative since late November 2025.
- ETFs had sold roughly 54,000 BTC during November. Early-2026 inflows of around 3,800 BTC were “roughly in line with the same period last year” — stabilisation, not accumulation.
- Seven-day exchange inflows had risen to about 39,000 BTC, the highest since late November. Coins moving onto exchanges after a relief rally tend to be coins preparing to be sold.
Many participants had already concluded the bear market was over. CryptoQuant argued the opposite: “fundamental and technical indicators still point out that we remain in a bear market.”
Bitcoin then fell to $58,566 by July 1, 2026. The call was right.
What distinguishes a rally from a reversal
The useful part isn’t that the call was correct — single calls get lucky. It’s the evidence they looked at, which works as a checklist regardless of what today’s market is doing:
- Is spot demand actually growing, or is price rising on derivatives alone?
- Are exchange inflows rising into the strength?
- Has the longer-term trend line been reclaimed and held for a few weeks, or merely touched?
- Is participation broadening across the market, or is one asset carrying everything?
None of these are signals in the sense of “if X then Y.” They are evidence. The same framework has produced false negatives — rallies it flagged that turned out to be the real turn. Anyone presenting this as a reliable top-and-bottom detector is selling something.
Every bear market in crypto history contained rallies that felt like the bottom. That isn’t a flaw in your judgement. It’s what bear markets are made of.
How long they actually last, and what the bottom looks like
Here are Bitcoin’s three completed bear markets, measured by CoinGecko’s published methodology — any continuous stretch where Bitcoin closed below its 200-day average for 30+ consecutive days, with drawdown measured from the prior record to the lowest daily close:
| Cycle | Duration | Max drawdown | Bottom |
|---|---|---|---|
| 2014–2015 | 321 days | −81.6% | $172 (Jan 14, 2015) |
| 2018–2019 | 385 days | −83.6% | $3,217 (Dec 15, 2018) |
| 2022–2023 | 381 days | −76.7% | $15,742 (Nov 10, 2022) |
| 2021 mid-cycle correction | 80 days | −52.9% | $29,972 (Jul 21, 2021) |
| 2025–2026 | ongoing | −53.5% | $58,566 (Jul 1, 2026) |
The durations are suspiciously similar — all three between 321 and 385 days, roughly a year each. Whether that’s a pattern or three coincidences is exactly the kind of question three data points cannot answer. And note that different tests give different dates: these figures come from one methodology, and others differ by weeks.
Recoveries weren’t instant either. From the bottom, reclaiming the 200-day average took between 65 days (2022–23) and 166 days (2014–15). The low isn’t the all-clear.
Capitulation is the word for the final phase, when remaining holders give up and sell into weakness. Bottoms tend to be quiet rather than dramatic, which is counterintuitive — people expect the low on the scariest day. It usually arrives afterwards, with no volume and no news, because there’s nobody left to panic.
Where this cycle sits
By depth, the current drawdown — around 53.5% at its worst, in July 2026 — is closest to the 2021 mid-cycle correction, not to any completed bear market.
One year after each previous peak, Bitcoin was down 69.7% (2013), 82.3% (2017) and 74.6% (2021). One year after the October 2025 peak it was down 32%, and by late October 2026 that had widened to about 36%. Either this is a structurally different regime — ETFs, institutional allocation, a market less dominated by leveraged retail — or the cycle isn’t finished. Both readings are live, and this article doesn’t need to pick one.
Where the four-year cycle fits
Bitcoin’s issuance halves roughly every four years, and the three completed cycles each peaked 12–18 months after a halving. That pattern, repeated three times, is what people mean by “the four-year cycle.”
The live dispute is whether it still holds. ETF flows and institutional allocation may have decoupled price from the issuance schedule, and the current cycle’s unusually shallow drawdown is the main evidence offered. The counter-argument is simpler: three data points are not a pattern you can declare broken on the strength of a fourth that’s still unfolding.
This article takes no position. “The cycle is dead” and “the cycle is intact” are both predictions wearing analysis clothes.
The mechanics — the four phases, the halving itself, the full case for and against — are covered in crypto market cycles.
What the labels are good for, and what to do instead
The useful part of the vocabulary is that it’s shorthand for regime, and regime genuinely affects what works. Momentum strategies work in trends, mean-reversion works in ranges. “We’re in a different regime” is often the right diagnosis for why one approach is making money and another isn’t.
The useless part is that as a trigger for your own decisions, the label is always late. By the time a bull run is identifiable enough to name, it’s partly over. By the time a bear market is widely called, most of the fall has happened. Worse, the label is most confidently applied exactly when it’s most dangerous — search interest in “bull market” tends to peak near tops rather than at the start of them.
So, three questions, in order:
- Which test? When anyone says bull or bear, the useful follow-up is “measured how?” It will often end the conversation, which is informative on its own.
- Does your plan depend on knowing? If your approach only works in one regime, you’ve taken a position on something you cannot measure in real time. That’s a bet, not a plan. Dollar-cost averaging is the obvious alternative, because it works identically in both — it never needs to know which one it’s in.
- What does being wrong cost? If I’m wrong about which one this is, what does that cost me?
That last question is the whole game.
Common misconceptions worth naming
- “A bull run means new all-time highs.” No. A bull run is a direction. Bitcoin has spent most of its history below a previous high while trending up.
- “Someone official declares a bear market.” Nobody does. Not in crypto, not in equities. Every label is a person applying a threshold they rarely state.
- “Down 20% means bear market.” In crypto that threshold fires constantly, including mid-bull-run.
- “A strong rally means the bear market is over.” Every crypto bear market has contained 20–40% rallies. That’s the normal texture of one, not evidence against it.
- “The bottom will be obvious.” Bottoms are quiet. The dramatic days are usually mid-decline; the low itself arrives with no volume and no news.
The words describe the past with confidence and the present with none. Every chart that makes cycles look obvious was drawn after the fact.
Common questions
What is a crypto bull run?
A crypto bull run is a sustained upward trend in prices, participation and risk appetite that lasts long enough to change how people behave in the market. It isn’t a specific price level or an all-time high — it’s a direction maintained over months. Bull runs are usually named retroactively, because there’s no official declaration and no agreed threshold for when one begins.
Are we in a crypto bull market or a bear market right now?
As of 26 October 2026, the common tests disagree. Bitcoin is about 36% below its October 2025 record high (bear by the drawdown convention), below its 50-day moving average (bear), below its 365-day average having reclaimed it in September and lost it again (bear), above its 200-day moving average (bull by CoinGecko’s methodology), and neutral on sentiment. Different reputable sources answer differently because they measure different things.
How long do crypto bear markets last?
Bitcoin’s three completed bear markets lasted 321 days (2014–15), 385 days (2018–19) and 381 days (2022–23), with drawdowns of roughly 77–84% from the prior peak. These figures come from one specific methodology — continuous stretches of 30 or more closes below the 200-day moving average — and other definitions give different numbers. The consistency around a year is real but rests on three data points.
What is a crypto winter?
A crypto winter is a prolonged downturn in which price falls and funding, hiring, developer activity and attention collapse — with the industry contraction continuing after price has stopped falling. It’s distinct from a bear market because the two don’t always move together. The 2018–2019 and 2022–2023 downturns both qualified. The current period has had the price pattern of a bear market without the industry pattern of a winter.
What is a bear market rally?
A bear market rally is a sharp, convincing rise inside a continuing downtrend. Crypto bear markets routinely contain rallies of 20–40%, each of which can look like the start of a new bull run. Telling them apart is probabilistic — looking at spot demand, exchange flows, whether longer-term trend lines are reclaimed and held, and whether participation is broadening. No single indicator reliably separates the two.
Where to go from here
- The mechanics of the cycle itself — the four phases, the halving, the “this time is different” debate: crypto market cycles.
- Why $19 billion could unwind in a day: what is liquidity in crypto.
- Why “altcoin season” arrives and leaves as one phenomenon rather than many: why do crypto prices move together.
- A strategy that doesn’t need to know which regime it’s in: dollar-cost averaging crypto.
- The other number people routinely misread as a verdict: what is market cap in crypto.
- The asset all of this is measured against: what is Bitcoin.
A note on financial advice
This article isn’t advice. It’s an attempt to make the vocabulary less misleading. Specific things to be careful about:
- Increasing position size because someone called a bull run. The call is late by construction.
- Treating a 30% rally as confirmation the bottom is in. Every past bear market contained rallies that size.
- Assuming the previous cycle’s depth and duration will repeat. Three data points is a pattern, not a law.
- Taking “the four-year cycle is dead” or “the four-year cycle is intact” as established fact. Both are predictions.
- Trading on a label that, by construction, is applied late.
Crypto carries a real risk of total loss regardless of which label applies. Only invest what you can afford to lose entirely, and make your own decisions based on your own situation.
The label changes nothing about what you should do. If your plan only works in a crypto bull run, it isn’t a plan — it’s a bet on the label.